Nodes - Summary of Node Information
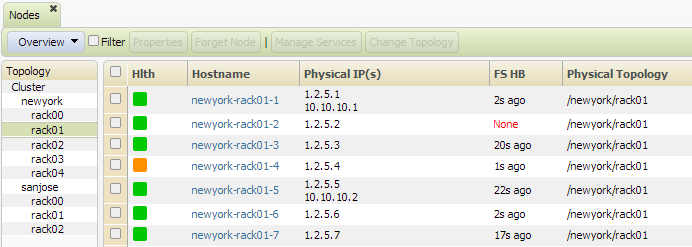
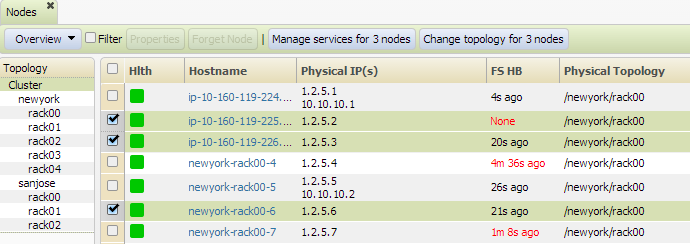
The Nodes view displays the nodes in the cluster, by rack. The Nodes view contains two panes: the Topology pane and the Nodes pane. The Topology pane shows the racks in the cluster. Selecting a rack displays that rack's nodes in the Nodes pane to the right. Selecting Cluster displays all the nodes in the cluster. Clicking any column name sorts data in ascending or descending order by that column.
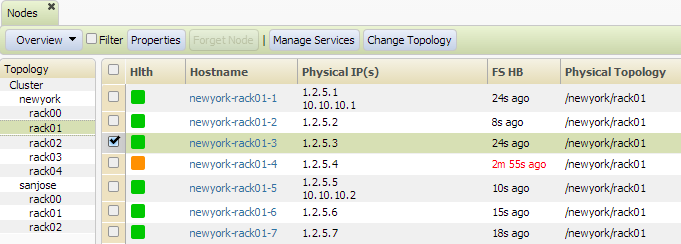
Selecting the checkbox beside one node makes the following buttons available:
- Properties - navigates to the Node Properties View, which displays detailed information about a single node.
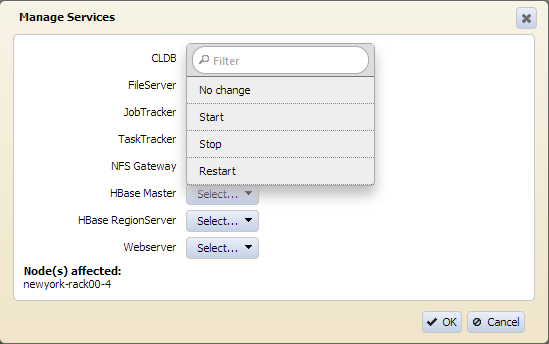
- Manage Services - displays the Manage Node Services dialog, which lets you start and stop services on the node.
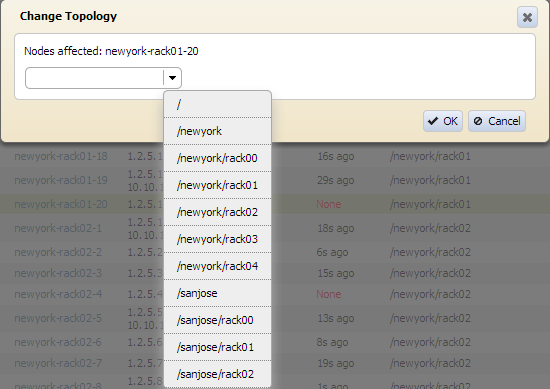
- Change Topology - displays the Change Node Topology dialog, which lets you change the topology path for a node.
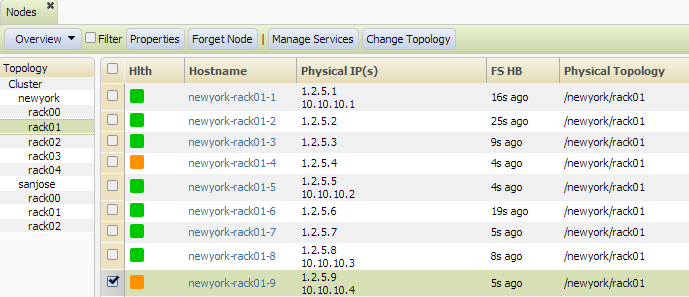
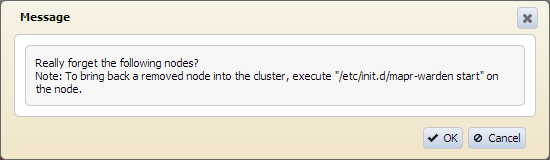
Note: If a node has a No Heartbeat alarm raised, the Forget Node button is also displayed.
When you click on Forget Node, the following Message appears:
When you click on Manage Services, a dialog is displayed where you can stop, start, or restart the services on the node.
When you click on Change Topology, a dialog is displayed where you can choose a different location for the selected node.
Selecting the checkboxes beside multiple nodes changes the text on the buttons to reflect the number of nodes affected:
The dropdown menu at the top left specifies the type of information to display:
- Overview - general information about each node
- Services - services running on each node
- Performance - information about memory, CPU, I/O and RPC performance on each node
- Disks - information about disk usage, failed disks, and the MapR-FS heartbeat from each node
- MapReduce - information about the JobTracker heartbeat and TaskTracker slots on each node
- NFS Nodes - the IP addresses and Virtual IPs assigned to each NFS node
- Alarm Status - the status of alarms on each node
Clicking a node's Hostname navigates to the Node Properties View, which provides detailed information about the node.
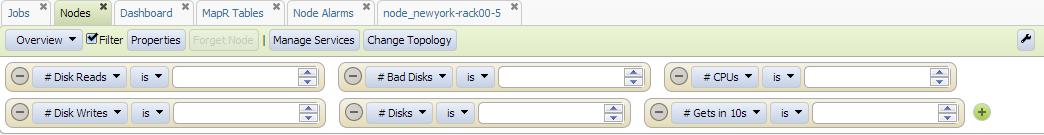
Selecting the Filter checkbox displays the Filter toolbar, which provides additional data filtering options.
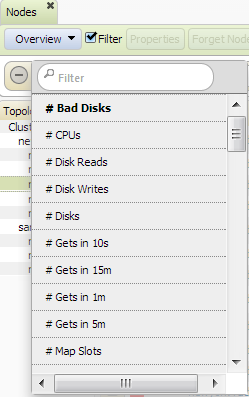
Each time you select a filtering option, the option is displayed in the window below the
filter checkbox. You can add more options by clicking on the  .
.