
Dashboard - Summary of Cluster Health, Activity, and Usage
The Dashboard displays a summary of information about the cluster in six panes.
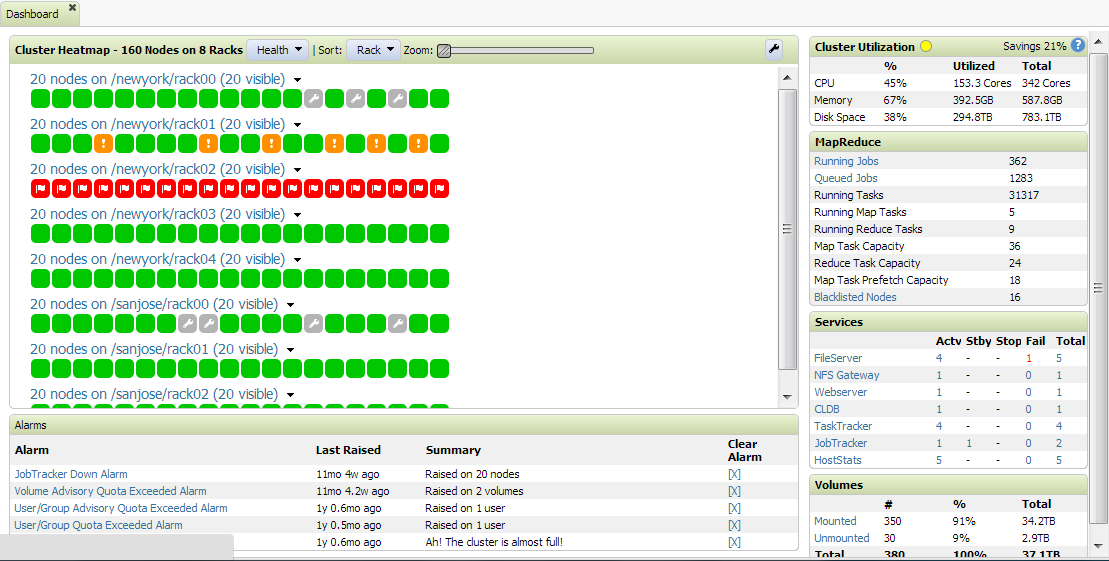
Panes include:
- Cluster Heatmap - the alarms and health for node, by rack
- Alarms - a summary of alarms for the cluster
- Cluster Utilization - CPU, Memory, and Disk Space usage
- Yarn - the number of running and queued applications, number of Node Managers, used memory, total memory, percent of memory used, CPU's used, CPU's total, percent of CPU's used
- MapReduce - the number of running and queued jobs, running tasks, running map tasks, running reduce tasks, map task capacity, reduce task capacity, map task prefetch capacity, and blacklisted nodes
- Services - the number of instances of each service
- Volumes - the number of available, under-replicated, and unavailable volumes
Links in each pane provide shortcuts to more detailed information. The following sections provide information about each pane.