
Jobs View
The Jobs view displays the data collected by the MapR Metrics service. The Jobs view contains two panes: the chart pane and the data grid. The chart pane displays the data corresponding to the selected metric in histogram form. The data grid lists the jobs running on the cluster.
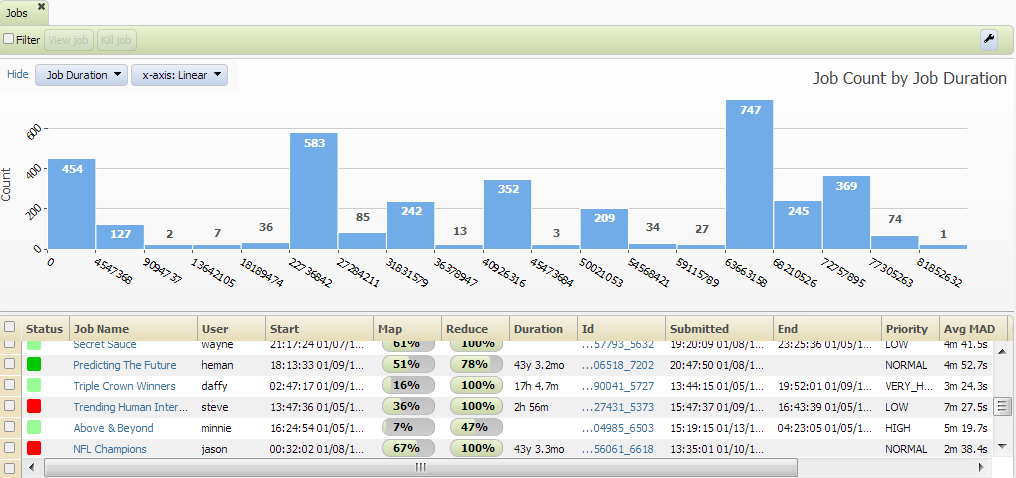
Click on the wrench icon to slide out a menu of information to display. Choices include:
- Cumulative Job Combine Input Records
- Cumulative Job Map Input Bytes
- Cumulative Job Map Input Records
- Cumulative Job Map Output Bytes
- Cumulative Job Map Output Records
- Cumulative Job Reduce Input Records
- Cumulative Job Reduce Output Bytes
- Cumulative Job Reduce Shuffle Bytes
- Cumulative Physical Memory
- Current CPU
- Current Memory
- Job Average Map Attempt Duration
- Job Average Reduce Attempt Duration
- Job Average Task Duration
- Job Combine Output Records
- Job Complete Map Task Count
- Job Complete Reduce Task Count
- Job Complete Task Count
- Job Cumulative CPU
- Job Data-local Map Tasks
- Job Duration
- Job End Time
- Job Error Count
- Job Failed Map Task Attempt Count
- Job Failed Map Task Count
- Job Failed Reduce Task Attempt Count
- Job Failed Reduce Task Count
- Job Failed Task Attempt Count
- Job Failed Task Count
- Job Id
- Job Map CPU
- Job Map Cumulative Memory Bytes
- Job Map File Bytes Written
- Job Map GC Time
- Job Map Input Bytes/Sec
- Job Map Input Records/Sec
- Job Map Output Bytes/Sec
- Job Map Output Records/Sec
- Job Map Progress
- Job Map Reserve Slot Wait
- Job Map Spilled Records
- Job Map Split Raw Bytes
- Job Map Task Attempt Count
- Job Map Task Count
- Job Map Tasks Duration
- Job Map Virtual Memory Bytes
- Job MapR-FS Map Bytes Read
- Job MapR-FS Map Bytes Written
- Job MapR-FS Reduce Bytes Read
- Job MapR-FS Reduce Bytes Written
- Job MapR-FS Total Bytes Read
- Job MapR-FS Total Bytes Written
- Job Maximum Map Attempt Duration
- Job Maximum Reduce Attempt Duration
- Job Maximum Task Duration
- Job Name
- Job Non-local Map Tasks
- Job Rack-local Map Tasks
- Job Reduce CPU
- Job Reduce Cumulative Memory Bytes
- Job Reduce File Bytes Written
- Job Reduce GC Time
- Job Reduce Input Groups
- Job Reduce Input Records/Sec
- Job Reduce Output Records/Sec
- Job Reduce Progress
- Job Reduce Reserve Slot Wait
- Job Reduce Shuffle Bytes/Sec
- Job Reduce Spilled Records
- Job Reduce Split Raw Bytes
- Job Reduce Task Attempt Count
- Job Reduce Task Count
- Job Reduce Tasks Duration
- Job Reduce Virtual Memory Bytes
- Job Running Map Task Count
- Job Running Reduce Task Count
- Job Running Task Count
- Job Split Raw Bytes
- Job Start Time
- Job Submit Time
- Job Task Attempt Count
- Job Total File Bytes Written
- Job Total GC Time
- Job Total Spilled Records
- Job Total Task Count
- Job User
- Logs
- Map Tasks Finish Time
- Map Tasks Start Time
- Priority
- Reduce Tasks Finish Time
- Reduce Tasks Start Time
- Status
- Virtual Memory Bytes
Select the Filter checkbox to display the
Filter toolbar, which provides additional data filtering options. The
x-axis: drop-down selector lets you change the display scale of the histogram's X
axis between a uniform or logarithmic scale. Hover the cursor over a bar in the histogram to
display the Filter and Zoom buttons. 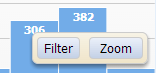
Click the Filter button or click the bar to filter the table below the histogram by the data range corresponding to that bar. The selected bar turns yellow. Hover the cursor over the selected bar to display the Clear Filter and Zoom buttons. Click the Clear Filter button to remove the filter from the data range in the table below the histogram.
Double-click a bar or click the Zoom button to zoom in and display a new histogram that displays metrics constrained to the data range represented by the bar. The data range applied to the metrics data set displays above the histogram.
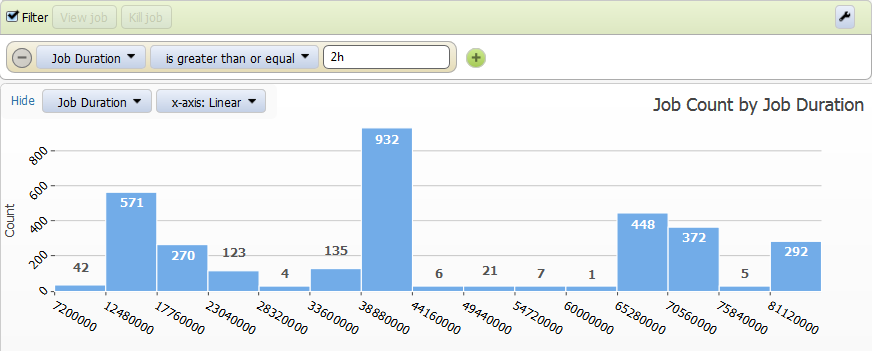
Click the plus or minus buttons in the filter conditions panel to add or remove filter conditions. Uncheck the Filter checkbox above the histogram to clear the entire filter.
Check the box next to a job in the table below the histogram to enable the View Job button. If the job is still running, checking this box also enables the Kill Job button. Clicking Kill Job will display a confirmation dialog to choose whether or not to terminate the job.
Click the View Job button or click the job name in the table below the histogram to open the Job tab for that job.