
Node Alarms
The Node Alarms view displays information about alarms on any node in the cluster that has
raised an alarm.
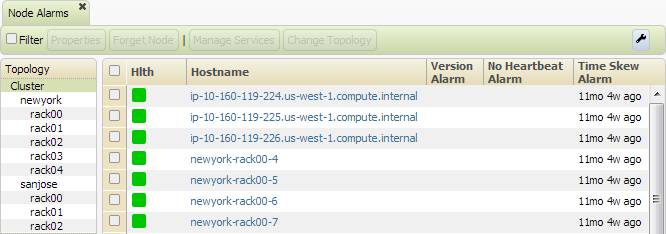
The first two columns display
- Hlth - a color indicating the status of each node (see Cluster Heat Map)
- Hostname - the hostname of the node
The remaining columns are based on alarm type, such as:
- Version Alarm - one or more services on the node are running an unexpected version
- No Heartbeat Alarm - no heartbeat has been detected for over 5 minutes, and the node is not undergoing maintenance
- UID Mismatch Alarm - services in the cluster are being run with different usernames (UIDs)
- Duplicate HostId Alarm - two or more nodes in the cluster have the same Host ID
- Too Many Containers Alarm - the number of containers on this node reached the maximum limit
- Excess Logs Alarm - debug logging is enabled on this node, which can fill up disk space
- Disk Failure Alarm - a disk has failed on the node (the disk health log indicates which one failed)
- Time Skew Alarm - the clock on the node is out of sync with the master CLDB by more than 20 seconds
- Root Partition Full Alarm - the root partition ("/") on the node is 99% full and running out of space
- Installation Directory Full Alarm - the partition /opt/mapr on the node is running out of space (95% full)
- Core Present Alarm - a service on the node has crashed and created a core dump file
- High FileServer Memory Alarm - the FileServer service on the node has high memory consumption
- Pam Misconfigured Alarm - the PAM authentication on the node is configured incorrectly
- TaskTracker Local Directory Full Alarm - the local directory used by the TaskTracker is full, and the TaskTracker cannot operate as a result
- CLDB Alarm - the CLDB service on the node has stopped running
- FileServer Alarm - the FileServer service on the node has stopped running
- JobTracker Alarm - the JobTracker service on the node has stopped running
- TaskTracker Alarm - the TaskTracker service on the node has stopped running
- HBase Master Alarm - the HBase Master service on the node has stopped running
- HBase RegionServer Alarm - the HBase RegionServer service on the node has stopped running
- NFS Gateway Alarm - the NFS Gateway service on the node has stopped running
- Webserver Alarm - the WebServer service on the node has stopped running
- HostStats Alarm - the HostStats service on the node has stopped running
- Metrics write problem Alarm - metric data was not written to the database, or there were issues writing to a logical volume
See Alarms Reference.
Note the following behavior on the Node Alarms view:
- Clicking a node's Hostname navigates to the Node Properties View, which provides detailed information about the node.
- The left pane of the Node Alarms view displays the available topologies. Click a topology name to view only the nodes in that topology.
Buttons:
- Properties - navigates to the Node Properties View
- Forget Node - opens the Forget Node dialog to remove the node(s) from active management in this cluster. Services on the node must be stopped before the node can be forgotten.
- Manage Services - opens the Manage Node Services dialog, which lets you start and stop services on the node
- Change Topology - opens the Change Node Topology dialog, which lets you change the rack or switch path for a node