Data Fabric Monitoring Storage Options
Describes various storage options for Data Fabric Monitoring. The Control System relies on Data Fabric monitoring components to display metrics, but can function without the monitoring components. Using Data Fabric monitoring to store logs is optional.
The following installation options are available for metric storage with OpenTSDB and log storage with Elasticsearch. You can store logs and metrics on a non-Data Fabric cluster but this scenario is not supported by Data Fabric.
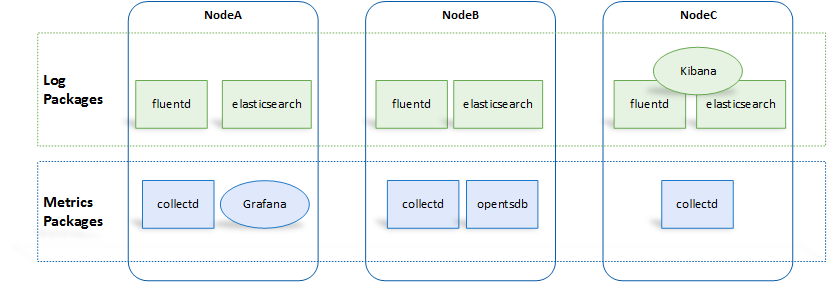
Store Metrics and Logs on the Monitored Cluster
You can store metrics and logs on the nodes in the same Data Fabric cluster that you want to monitor. Note that installing Grafana is optional.
Store Metrics and Logs on a Storage Cluster
You can store metrics and logs for the Data Fabric cluster that you want to monitor, on nodes in a different Data Fabric cluster.
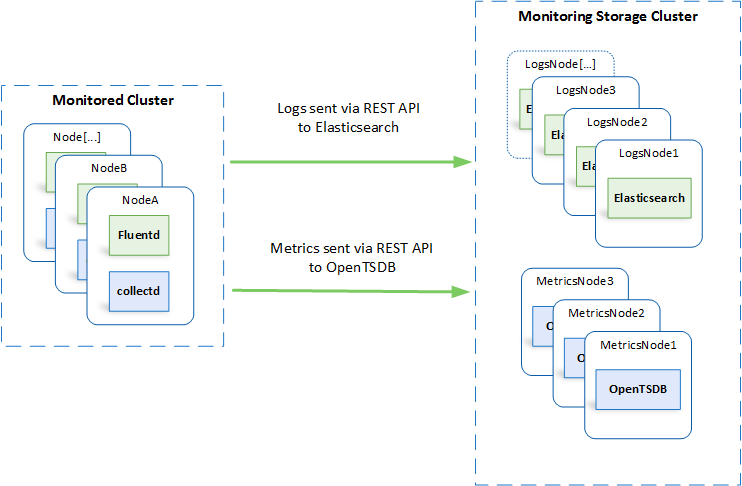
In this case, Kibana and Grafana can be installed on either cluster.
Use a Single Cluster to Store Monitoring Data for Multiple Clusters
You can store metrics and logs for more than one Data Fabric cluster on a shared set of nodes. With this option, a single dashboard can monitor multiple clusters.
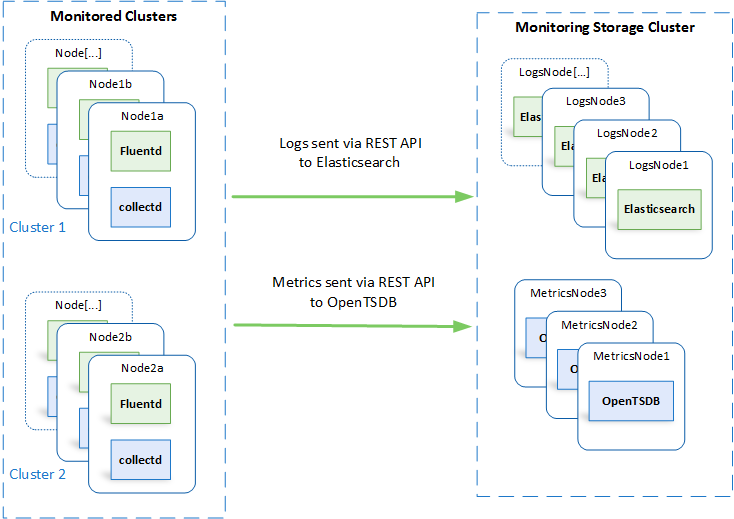
In this case, Kibana and Grafana can be installed on any of these clusters.